


Traffic at major U.S.-Canada borders recently slowed. While some stakeholders watching border crossings and port traffic for signs of trade disruption may attribute that slowdown to President Trump’s tariffs, the reality is those lulls in freight traffic can be associated with Canada’s celebration of Victoria Day on May 19 and Memorial Day in the U.S. the following week.
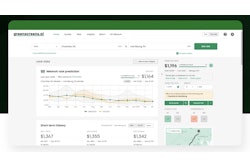
That’s why Altitude, Geotab’s data and analytics transportation platform, recently launched its Tariff Trend Tracker.
“These holiday-related lulls are important to distinguish, as they aren’t indicative of a tariff-driven trend or a broader sustained decline in freight demand,” Nate Veeh, associate vice president of market development at Altitude by Geotab, wrote on the Freight Traffic Vs. Tariffs Impact - Trend Tracker website. “Rather, these predictable dips serve as a useful confirmation that our data accurately mirrors the real-world operational rhythms and temporary slowdowns characteristic of the market, further grounding our overall analysis of transborder traffic.”
The tracker uses anonymized data from Geotab’s connected vehicle dataset to offer insights into commercial vehicle (specifically Class 7 and 8) movement across major bridge crossings and key ports. Land crossings, which highlight the impact from tariffs on Canada, include Ambassador Bridge, Blue Water Bridge, Montreal to New York, Peace Bridge, and Vancouver. Key ports, which highlight the impact from tariffs on China, include Los Angeles, Long Beach and Oakland, California, Seattle and Vancouver.
Altitude placed geofences around the ports to monitor trucks entering and leaving on a daily basis. For border crossings, Altitude uses origin and destination route analytics.
Data scientists then analyze those numbers week over week, and the analysis is provided on the website. The information isn’t limited to Geotab customers.
The tracker offers weekly insights into trade flow changes and provides context for businesses involved in cross-border trade, logistics companies managing supply chains, and policymakers evaluating trade regulations. Insights come from Geotab’s commercial telematics dataset, which consists of anonymized data from 5 million vehicles globally and 15% to 20% of commercially registered fleet vehicles in North America. Veeh said Altitude was able to expand the data up from the sample to offer a view of the entire fleet population.


He said Altitude built the tracker to deliver data-based truth amid a sea of voices.
“Because we have such a good sample on all the trucks that are picking up goods, whether it be port or cross-border, we can tell whether it’s a big impact that's probably put in place by a tariff or if it’s just natural trends that are happening, observed in our historical data,” Veeh said. “There's no modeling or forecasting. It's more like a fact checker in the sense that there's all these hypotheses that things are going to happen … Nobody truly knows, so I think this is that source that can provide some of that truth to the unknown.”
Since it started analyzing ports and border crossings late last year, Altitude’s data has shown some localized shifts in commercial vehicle volume, indicating minor variations rather than considerable fluctuations across different border crossings and port locations.
The increases and decreases of freight movement have been normal when comparing current data to historical data, Veeh said.
“We haven't seen any major drop-offs,” he said. “In reality, it's not like what everybody thought it was going to be so far. A lot of people thought it was going to take a major dip, and we haven't seen that yet through the data.”
Veeh plans to keep the tracker up for a while to see if there are any “gotchas” that happen. There are ongoing developments with the tariffs.
The U.S. Court of International Trade on Wednesday nullified Trump’s tariffs, but the Court of Appeals for the Federal Circuit on Thursday granted the Trump administration’s request to temporarily pause the ruling.
The tracker will continue to monitor freight traffic – isolating tariff effects from other variables – to help business, including fleets, adjust their business models accordingly. Veeh said the biggest takeaway for fleets is probably the ability to benchmark their operations against the rest of the fleet population.
He said it’s also possible for fleets that use other business intelligence tools like Power BI or Tableau to overlay data on top of data from the tracker for greater insights.
Veeh said the tracker may evolve to include additional locations to obtain understanding of supply chain flows as developments surrounding the tariffs continue.


![Reintroducing The Mack Anthem Rebuilt For Regional Haul[79]](https://img.ccjdigital.com/mindful/rr/workspaces/default/uploads/2026/07/reintroducing-the-mack-anthem-rebuilt-for-regional-haul79.FdrR1gEDrK.jpg?auto=format%2Ccompress&fit=crop&h=167&q=70&w=250)
