“The performance of the nation’s transportation system is not keeping pace with the rate of growth of the demands on that system,” says Thomas J. Donohue, president and chief executive officer of the U.S. Chamber of Commerce. “As our economy recovers, the nation’s transportation infrastructure must be prepared to meet the projected growth in freight and population. In fact, a 10-point improvement in the new national transportation index could generate 3 percent more growth in the nation’s Gross Domestic Product. However, our index shows that from now through 2015, there will be a rapid decline in the performance of the system if we continue business as usual. Right now we’re on an unsustainable path.”
The annual Transportation Performance Index combines indicators of supply (availability), quality of service (reliability, predictability and safety) and utilization (potential for future growth) across all modes of passenger and freight transportation – highway, public transportation, freight railroad, aviation, marine and intermodal – to show how well the U.S. transportation system is serving the needs of businesses and the overall U.S. economy.
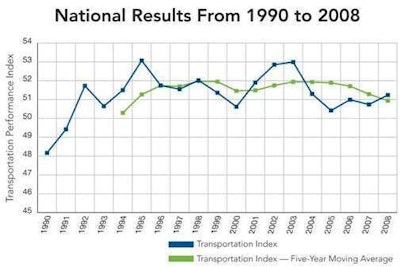
The national index is 51.24 in 2008, which is a slight improvement from 50.74 in 2007. However, the moving average, which smooths the annual variations, reveals a clear downward trend from 2003 to 2008, demonstrating that the performance of the U.S. transportation system is not keeping pace with the demands on that system. Thursday’s release covers the time period from 1990 to 2008, the last year for which national-level date is available. Over this period the index – or the performance of our transportation system – increased only about 6 percent, while U.S. population during that time period grew 22 percent, passenger travel grew 39 percent and freight traffic grew 27 percent.
The blue line in the chart shows the national results of the Transportation Performance Index. The green line is a five-year moving average. “The bottom line is this: Our nation’s deteriorating infrastructure is placing a major drag on our economic growth,” Donohue says. “We must focus on improving the way transportation delivers for business, removing barriers to maintaining, modernizing and expanding our nation’s transportation infrastructure, and driving increased public and private investment.”
The 2007 state results range from 85.12 for North Dakota to 35.08 for the District of Columbia. While the District of Columbia is somewhat of an anomaly, New Jersey has the next lowest index with a value of 46.71.
Higher population growth rates and higher population densities generally are associated with lower index value based on an analysis of state results versus population data. While this warrants more rigorous analysis, a closer examination of the states with an index value of less than 60 reveals that these states experience significant pressure in terms of population growth, high levels of development and limited access to or aging infrastructure.
A highly ranked state like North Dakota cannot afford to ignore the importance of pressures on the transportation system in states like New Jersey. For example, to double U.S. exports by 2015, the nation’s transportation system as a whole must work efficiently to get U.S. products to the world’s markets.
“The gap between the national index and the best performing states is 20 points wide,” Donohue says. “We’re leaving $1 trillion on the table in GDP by not getting the most bang for the buck out of our transportation system. If we don’t head off that decline, we’re taking money out of every American’s pocket.”
For each one point improvement in the Transportation Performance Index, U.S. GDP increases by 0.3 percent. For 2007, 0.3 percent of GDP equals $42.1 billion.
In 2011, the Chamber will release indexes for water, energy, broadband and a composite Infrastructure Performance Index.
For additional information on the Transportation Performance Index, including state-by-state results, graphs, the accompanying technical report and the Chamber’s policy recommendations for getting U.S. transportation performance back on track, go to www.letsrebuildamerica.com. The indexes are available at www.uschamber.com/lra/transportation-index.


