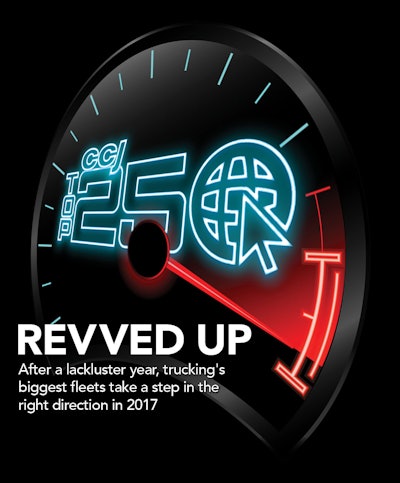
After a soft year in 2016, CCJ Top 250 fleets rebounded with a solid recovery in 2017. Tight capacity and favorable market conditions in many segments show no signs of abating anytime soon.
 Click here to access the full, interactive 2018 CCJ Top 250 rankings and request a downloadable PDF, or visit CCJTop250.com. There you can also find listings broken down by revenues or number of trucks, tractors, trailers or drivers, and by type of haul and geographic region.
As the trucking industry closed the books on an anemic business year in 2016, a new White House administration had many fleet owners optimistic of a pro-business, low-regulatory environment in 2017.
The U.S. economy turned in an anemic 1.2 percent Gross Domestic Product growth rate in the first quarter last year, but economic pistons were firing behind the scenes, including growth in manufacturing, consumer spending and housing starts.
By the second quarter and throughout the rest of 2017, GDP was growing at a healthy clip of roughly 3 percent, and the fortunes of many of the trucking industry’s largest fleets began to change for the better.
Revenues on the rise
Truck tonnage was up 3.8 percent overall in 2017, according to the American Trucking Associations’ For-Hire Truck Tonnage Index. During a five-month stretch between July and November, tonnage was up 9.6 percent before tapering off in December. Through the first five months of 2018, tonnage has increased 8.0 percent compared to the same period in 2017.
The sharp increase in available freight, coupled with one of the tightest capacity situations on record, has allowed many fleets to negotiate double-digit freight rate increases.
The Cass Truckload Linehaul Index, a measure of changes in per-mile truckload linehaul rates, increased 9.35 percent from June to December 2017. Donald Broughton, principal and managing partner of Broughton Capital and analyst and commentator for the Cass indexes, said the current freight environment dating back to mid-2017 represents “the strongest normalized percentage level of truckload pricing achieved since deregulation.”
As a result, carriers in the CCJ Top 250 reported healthy revenue gains in fiscal-year 2017 overall at 8.47 percent (based on carriers that self-reported or publicly filed financial information for both 2016 and 2017).
The flatbed/specialized/heavy haul segment, buoyed by a recovery in U.S. construction spending that began in the third quarter of 2017 and a rebounding fracking industry, turned in the highest revenue gains of any segment at 23.8 percent. The construction market has showed no signs of slowing down, leading to one of the tightest capacity environments in recent memory as shippers wait as long as two weeks for flatbed truck service.
The intermodal segment also reported significant revenue increases from 2016 to 2017 at 20.6 percent. That segment has performed remarkably well since the latter half of 2017 as shippers move more freight to rail as a result of tight capacity and higher rates among traditional truckload carriers.
Carriers in the dedicated contract carriage segment also reported double-digit revenue gains with a 13.8 percent increase in 2017 as shippers panicked to nail down long-term contracts and secure capacity.
In fact, every one of the nine segment groups in the CCJ Top 250 reported positive year-over-year figures, with the household goods and motor vehicles segments bringing up the rear with revenue growth of 1.5 percent and 2.7 percent, respectively.
CCJ Top 250 Breakdown by Segment
* Excludes outlying operations that likely would skew a segment’s figures for various reasons, such as their unusual scope or operating profile or the inclusion of revenues that is beyond either North America or transportation by truck.
** Based on companies that self-reported revenue data for both 2016 and 2017.
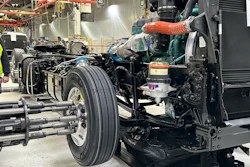
According to data collected by industry analyst firm FTR, monthly Class 8 truck orders have nearly doubled on a year-over-year basis starting last August, peaking at 47,200 units in January, a 116 percent increase from January 2017. Earlier this summer, OEMs reported the best June on record with 41,800 units ordered, a 140 percent increase from June 2017.
But most of the new tractor orders have gone to equipment replacement rather than fleet expansion. Carriers that appear in the CCJ Top 250 for both 2017 and 2018 added only 5,078 power units, a year-over-year increase of just 1.18 percent (excluding package giants UPS and FedEx that added a combined 8,478 trucks and tractors since last year’s ranking). Trailer counts increased 2.32 percent in the same time.

Companies in the intermodal segment of the CCJ Top 250 logged the biggest gain in equipment at 12.28 percent, largely because of Evans Network of Companies’ acquisitions of Greatwide Truckload Management and Packard Transport with roughly 1,000 power units. Carriers in the dedicated contract carriage segment logged the second-biggest equipment increase at 9.83 percent.
Fleets in the refrigerated segment saw little change in equipment counts year-over-year, while the motor vehicles segment was the only group to experience contraction, falling from 10,471 power units last year to 9,721 this year, a 7.16 percent decline.
The biggest growth inhibitor for North America’s largest fleets is also the no. 1 problem in the industry: the driver shortage. Again, excluding UPS and FedEx’s figures of 14,682 additional drivers, driver counts for carriers appearing in both the 2017 and 2018 CCJ Top 250 rankings increased 3.05 percent (14,926 additional drivers).
Driver growth by CCJ Top 250 companies still outpaced power unit growth nearly three-to-one, but much of that went to fill empty seats and put idle equipment back on the road. The driver shortage remains a barrier to organic fleet growth in 2018 and continues its tightening grip on truck capacity.
Mergers and acquisition activity on the rise
There were nearly a dozen major mergers and acquisitions among CCJ Top 250 fleets in 2017, none larger than the union of Swift Transportation and Knight Transportation. Last September, the two Phoenix-based truckload heavyweights officially combined to form Knight-Swift Transportation Holdings (CCJ Top 250, No. 3) with a reported $5.136 billion in revenue in 2017. Earlier this year, Knight-Swift acquired Abilene Motor Express (No. 221 last year), a 400-truck outfit from Richmond, Va., with roughly $100 million in annual revenues.


North of the border, C.A.T. (No. 134) shot up this year’s rankings after purchasing fellow Canadian truckload firm SLH Transport (formerly No. 147), tripling its tractor and driver counts in the process.
In an $83 million bid, Covenant Transportation Group (No. 38) acquired Greeneville, Tenn.-based Landair (formerly No. 226), adding 430 trucks and 900 trailers, and Eagle Express (No. 74) acquired Beam Bros. Trucking (formerly No. 195).
Also just announced is Penske Logistics’ acquisition of Epes Transport System (formerly No. 91), one of North Carolina’s largest trucking companies with 1,299 power units, 1,381 drivers and more than $200 million in annual revenue.
Flatbed consolidator Daseke (No. 23) continues to shoot up the CCJ Top 250 rankings, putting together a string of acquisitions in the last year, including Aveda Transportation, Tennessee Steel Haulers, The Roadmaster Group and Moore Freight Service. Daseke’s annual revenues have increased from $818 million to $1.44 billion since last year’s report.
In the intermodal segment, NFI (No. 28) acquired California Multimodal (formerly No. 227), a nationwide drayage trucking and warehousing service provider, while in the tank/bulk commodities segment, Kenan Advantage Group (No. 15) purchased the fuels-transportation assets of Mission Petroleum Carriers (formerly No. 214).